What gets measured, gets fixed. If you're not tracking the state of something, you won't know what to improve or fix. Monitoring is the collection of the performance metrics of a system like, latency, user requests, error rates, etc, and then analysing the data to get some meaningful information and understand the state of the system as well as sharing that data with others to enable them to make proper decisions.
Four golden signals of monitoring
traffic: tells us about system demand: queries/second. When to scale up a system to handle increased load or scale it down to make it cost-effective. For databases, this could be measured by transactions performed or sessions created.
latency: measure of time taken by a service to process incoming requests & send a response. Helps us to detect service degradation early on. However, we do need to distinguish b/w latency of failed & successful requests, eg: 5XX error responses due to a lost connection to the DB or other backend are served very quickly but this will skew our successful requests latency if we account for both our failed and successful requests latency together.
error rate: measure of failed client requests, aka 5XX responses. But sometimes even 200 responses can be erroneous due to the latency breaching the SLOs or the response data being wrong/missing. So, these errors need to be measured via code logic or instrumentation.
saturation: measure of resource utilization by a service eg: memory, compute, network I/O, etc. Helps us fix service performance degradation early on.
The above are measured at the service end. We also need to measure the user experience delivered at the client end by using 3rd party monitoring to monitor the service from outside the service infrastructure.
Why is monitoring important?
identify issues quickly and fix them reducing their impact. done by setting up necessary alerts based on the collected metrics
help make business decisions like which features to add, which geographical regions to focus on, determining the product release cycle, etc
helps forecast resource demands for services and allocate them effectively
Bonus: three pillars of observability
Monitoring enables failure detection, observability helps in better understanding the system. It helps us not only detect issues but also where the issue is and what is causing it. These 3 are provided via: monitoring, logging & tracing -- the 3 pillars of observability.
Observability is derived from control theory where it's defined as a measure of how well the internal states of a system can be inferred from knowledge of its external outputs. Modern applications have complext architectures, hence various factors that can lead to failures. Monitoring only helps us prevent past failures. To address these various other factors, we need observability which provides highly granular insights into the implicit failure modes as well as provides ample context about a system's inner workings which helps us uncover deeper systemic issues.
Logs
Logs are a record of activities that a service performs during its runtime, with a corresponding timestamp. While monitoring provides an abstract information of system degradations, logging gives a detailed view of what is causing these degradations. Logs help us go back in time to troubleshoot failures and understand the application's behaviour via errors, exceptions, etc.

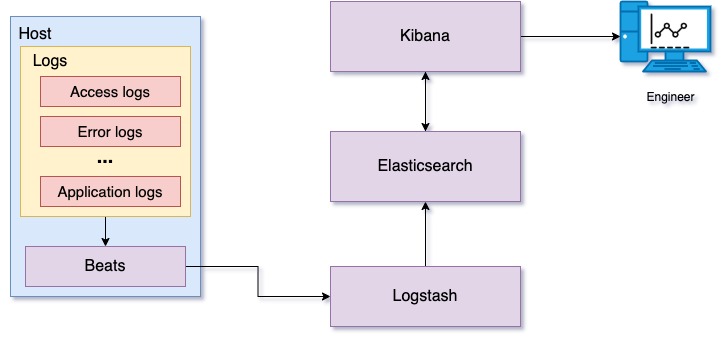
Logging setup with ELK stack and filebeat: Filebeat watches service log files and ships the log data to Logstash. Logstash parses these logs and transforms the data, preparing it to store on Elasticsearch. Transformed log data is stored on Elasticsearch and indexed for fast retrieval. Kibana searches and displays log data stored on Elasticsearch. Kibana also provides a set of visualizations for graphically displaying summaries derived from log data.
Tracing
Metrics give an abstract overview of the system, and logging gives a record of events that occurred. Imagine a complex distributed system with multiple microservices, where a user request is processed by multiple microservices in the system. Metrics and logging give you some information about how these requests are being handled by the system, but they fail to provide detailed information across all the microservices and how they affect a particular client request. If a slow downstream microservice is leading to increased response times, you need to have detailed visibility across all involved microservices to identify such microservice. The answer to this need is a request tracing mechanism.
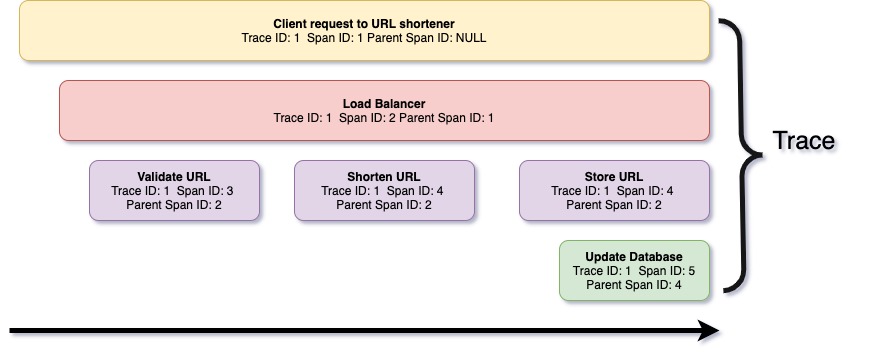
A trace is a series of spans, where each span is a record of events performed by different microservices to serve the client's request. In simple terms, a trace is a log of client-request serving derived from various microservices across different physical machines. Each span includes span metadata such as trace ID and span ID, and context, which includes information about transactions performed. Below is a graphical representation of a trace captured for a simple URL shortener application.

The tracing infrastructure comprises a few modules for collecting traces, storing them, and accessing them. Each microservice runs a tracing library that collects traces in the background, creates in-memory batches, and submits the tracing backend. The tracing backend normalizes received trace data and stores it on persistent storage. Tracing data comes from multiple different microservices; therefore, trace storage is often organized to store data incrementally and is indexed by trace identifier. This organization helps in the reconstruction of trace data and in visualization. Below is an anatomy of distributed tracing.
Conclusion
Hence, a robust monitoring and alerting system is necessary for maintaining and troubleshooting a system. Metrics give very abstract details on service performance. To get a better understanding of the system and for faster recovery during incidents, you might want to implement the other two pillars of observability: logs and tracing. Logs and trace data can help you understand what led to service failure or degradation.


